tl;dr
Today there’s a new module available in jamovi: esci (effect sizes and confidence intervals), developed by Bob Calin-Jageman and Geoff Cumming (@TheNewStats and TheNewStatistics.com). As a newer module you will need a recent version of jamovi to install esci-–probably 1.2.19 or above. You can refresh your install of jamovi here.
esci provides an easy step into estimation statistics (aka the “new statistics”), an approach that emphasizes effect sizes, interval estimates, and meta-analysis. esci can provide estimates and confidence intervals for most of the analyses you would learn in an undergraduate statistics course and meta-analysis (which really should be part of a good undergraduate statistics course). Most analyses can be run from raw data or from summary data (enabling you to generate estimates from journal articles that only reported hypothesis tests). All analyses generate nice visualizations that emphasize effect sizes and uncertainty. esci is for everyone, but was developed especially with students in mind–it provides step-by-step instructions, clear feedback, and tries to prevent rookie mistakes (like calculating a mean on a nominal variable).
What is estimation statistics?
Inferential statistics has two major traditions: testing and estimation. The testing approach is focused on decision-making. In this approach we propose a null hypothesis, collect data, generate a test-statistic and p-value measuring the degree to which the null hypothesis is compatible with the data, and then make a decision about the hypothesis. For example, we might test the null hypothesis that a drug has exactly 0 effect on depression. We collect data from those randomly assigned to take the drug or placebo. We run a t-test comparing these groups and find p = .01. We then make a decision: because p < .05 we reject the null hypothesis, deciding that an effect of exactly 0 is not compatible with the data. Huzzah.
The testing approach has its uses, but note two important issues that we have not been addressed: 1) How much does the drug work? and 2) How wrong might we be? That’s where estimation comes in. From the same data and assumptions that underlie the testing approach we can generate an estimate and a confidence interval. So, for example, we might find that the drug improved depression by 10% with a 95% CI of [1%, 19%]. This is some very useful information. It tells us how well the drug worked in this one study (10% benefit). It also gives us an expression of uncertainty about this estimate. Specifically, the CI gives the entire range of benefits that are compatible with the data collected– benefits around 1% are compatible and so are benefits around 19%.
Focusing on estimates can be really helpful:
- It helps us weigh practical significance rather than just statistical significance.
- It helps us calibrate our conclusions to the uncertainty of the study
- It fosters meta-analytic thinking, where we combine data from multiple studies to refine our estimates (like the poll aggregators on fivethirtyeight.com)
- It calibrates expectations for replications
- It helps us think critically about optimizing procedures to maximize effect sizes and minimize noise
- And much more
Estimates and tests are linked. A null hypothesis is rejected at the alpha = .05 level if it is outside a 95% CI and not rejected if it is inside. To put it a different way, a 95% CI is all the null hypotheses you would not reject at alpha .05 (and a 99% CI all those for alpha .01, etc.). This means that if you have an estimate, you can still conduct a test–in fact you can test any null hypothesis just by checking for it in the CI. The converse is not true, though: knowing that a test is statistically significant does not easily let you know the magnitude of the effect or the uncertainty around it. So when you focus on estimation you gain some benefits, but you don’t lose anything. That makes it rather bizarre that some fields have come to use only testing. esci is part of an effort to change this around, and to make estimation the typical or default approach to inference.
Want to know more about estimation? Here are some sources:
- Undergraduate textbook: Cumming, G., & Calin-Jageman, R. J. (2017). Introduction to the new statistics: Estimation, open science, and beyond. New York: Routledge. On Amazon.
- Calin-Jageman, R. J., & Cumming, G. (2019). The New Statistics for Better Science: Ask How Much, How Uncertain, and What Else Is Known. The American Statistician, 73(sup1), 271–280. https://doi.org/10.1080/00031305.2018.1518266
An example with esci
Let’s use esci to re-analyze data from a famous paper about the “trust drug” oxytocin. Oxytocin is a neurohormone best known for its role in human reproduction. But in 2005, Kosfeld et al. followed up on some interesting work in rodents to examine if oxytocin might influence trust in humans. The researchers randomly assigned participants to receive oxytocin (squirted up the nose) or placebo (also squirted up the nose) before playing an investment game that depended on trusting an anonymous partner. The average amount invested by each participant was used as a measure of trust. Kosfeld et al. found that oxytocin produced a statistically significant increase in trust (t(56) = 1.82, p = .037 one-tailed)*.
That sounds pretty convincing, right? It must have been, as the paper was published in Nature and has now been cited over 4,000 times. Right from the start, citations made the effect seem established and unequivocal. But how much did oxytocin improve trust and how wrong might this study be?
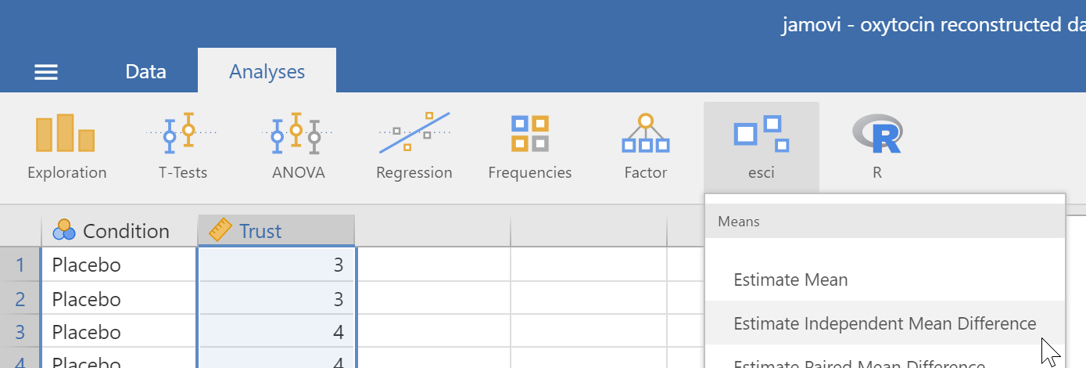
Let’s take a look. The original data is available in .csv format here**. Opening it in jamovi you can conduct a standard t-test to confirm that the difference is statistically significant (for a directional test). Now let’s generate the estimate and CI in esci using “Estimate Independent Mean Difference”.
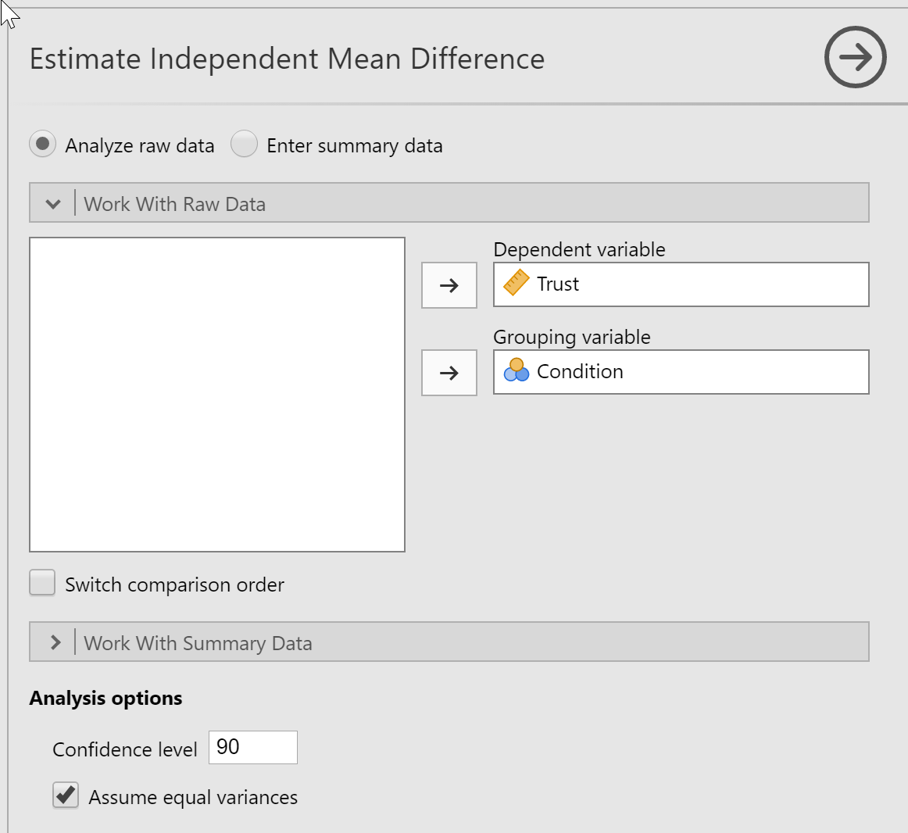
In the analysis options, we’ll enter Trust as the dependent variable and Condition as the grouping variable (placebo was coded as a 0; oxytocin as a 1). We’ll also set the confidence level to 90% to match the stringency of a directional test.
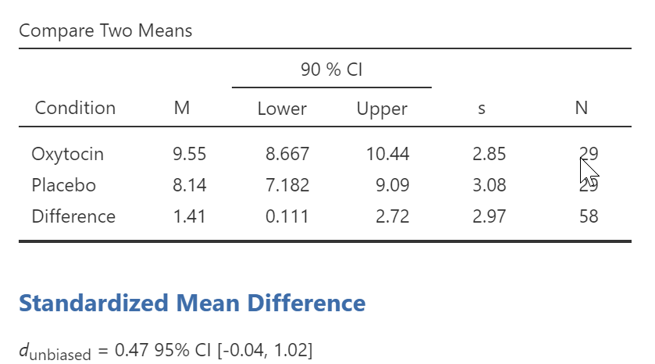
Our output emphasizes the effect size, which in this case is the difference in means, and reports this as both a raw difference (with a CI) and as a standardized difference (also with a CI):
esci also generates a difference plot. This shows the oxytocin data (all participants and the group mean with CI) and the placebo data (all participants and the group mean with CI). Most importantly, the graph emphasizes the difference between them: we draw a line from the placebo group, considering that our benchmark, and then we measure the space between the groups, marking the difference (delta) with a triangle on a right-side axis anchored at 0 to the placebo group. It sounds a bit complicated to write it out, but just take a look.
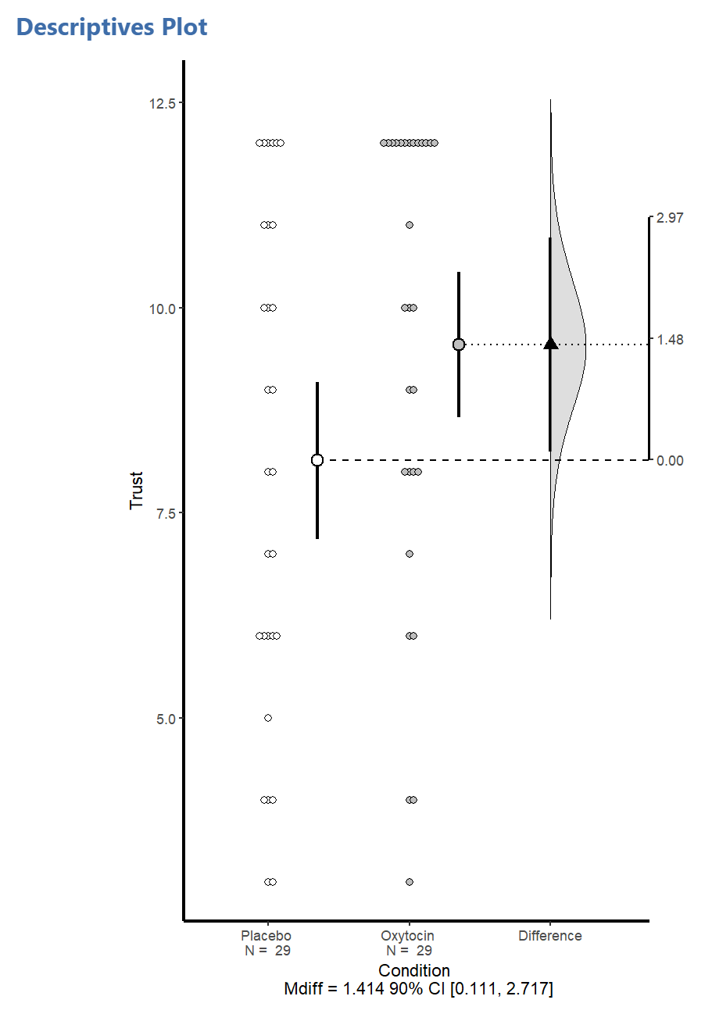
The graph shows that the difference in trust was fairly huge–a $1.41 increase in investment in a context where a typical investment was $8-9. The change, though, is highly uncertain, with a 95% CI that runs from $0.11 up to $2.71. This means the data is compatible with a very large range of effect sizes–from the vanishingly small to the dazzlingly large. In other words, this study doesn’t really tell us much about how much oxytocin might influence trust. Perhaps not 0, but basically almost any other positive effect size is on the table, including ones (around $0.11) that would be very difficult to replicate.
Looked at with these eyes, it might not surprise you much to find out that the benefit of oxytocin in human trust has not replicated well–and that the consensus is that oxytocin probably does not have a practically significant effect on trust. Unfortunately this was not obvious to researchers wedded to the testing approach, and so much faith was put in these results that clinical trials were launched to try to use oxytocin as a therapy for social processing deficits (such as with autism-spectrum disorder). None of these clinical trials have shown much benefit, but they’ve cost a ton and produced a decent handful of (thankfully mild) adverse reactions. If you’re curious about the way the oxytocin story imploded at great costs and hardship, check out the article here.
This is just one example of how you can gain important insight into your data by using estimation thinking in place of or as a supplement to testing. esci should make it easy to get started with this approach.
* — In the original study the researchers didn’t actually use a t-test; they compared median trust using a non-parametric test. This nuance doesn’t alter the patterns in the data presented in this post.
** — This data was extracted by Bob and Geoff from a figure in Kosfeld et al. (2005). The OSF page where it is posted has all the details.
I’m used to running this test… what would I use in esci?
Glad you asked. Here’s how the most common statistical tests map on to the estimates generated by esci:
| Traditional hypothesis test | esci in jamovi command |
| One-sample t-test | Estimate Mean |
| Independent samples t-test | Estimate Independent Mean Difference |
| Paired samples t-test | Estimate Paired Mean Difference |
| One-Way ANOVA | Estimate Ind. Group Contrasts |
| 2×2 ANOVA | Estimate Ind. 2×2 |
| 2×2 Chi Squared | Estimate Proportion Difference |
| Correlation test | Estimate Correlation |
| Correlation test with categorical moderator | Estimate Correlation difference |
This module would be better if…
The esci module is still in alpha. Geoff and Bob have made this initial release to help gather feedback as they continue to work on the module in conjunction with a new edition of their statistics textbook. They welcome your feedback, feature requests, and/or bug reports. Please especially consider esci through the eyes of your students:
- What other analyses would you like to see?
- Anything in the output that is hard to understand? That should be labelled better? That should be added or could be removed?
- Would it be helpful to add the option to see all assumptions for an analysis? Should we provide more guidance on interpreting output?
- Any options missing from analyses?
The best way to provide feedback would be on the github page for this module, which is here: https://github.com/rcalinjageman/esci. If that’s a hassle, then by all means just email Bob directly or tweet at them @TheNewStats.
Haven’t I heard of this before?
Yes – Geoff Cumming has been developing versions of esci for some time. The original versions were designed as worksheets in Excel. And in addition to analyses, the older version of esci has some great simulations and sample-size planning tools. You can still check these out here: https://thenewstatistics.com/itns/esci/.
Comments