tl;dr
Scientific data often requires a number of transformations before analysis; sum scores, log transformations, z-transformations, centering, etc. For those who’ve missed it, jamovi provides a very sexy ‘compute variables’ facility.
Adding Computed Variables
As of version 0.8 of jamovi, there are two types of variables (or columns); ‘data’ variables and ‘computed’ variables. Data variables are the variables we’re used to; static numbers which are either loaded from a data file, or typed in. Computed variables are those that take their values from performing a computation on other variables. As we’ll see, a range of different computations are possible.
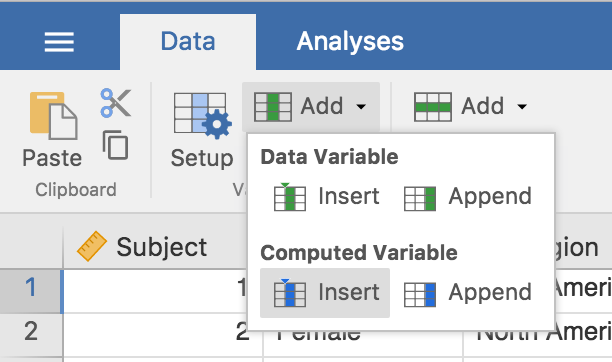
Adding computed variables to a jamovi spreadsheet is straightforward, either:
-
Select ‘Add variable’ from the data tab
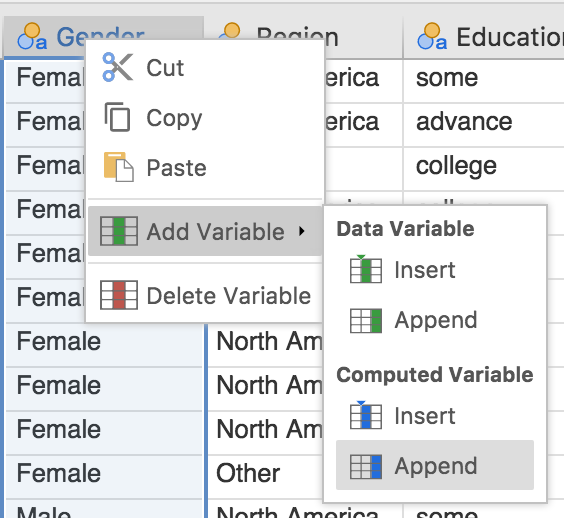
-
Right click on the column header, and select ‘Add variable’
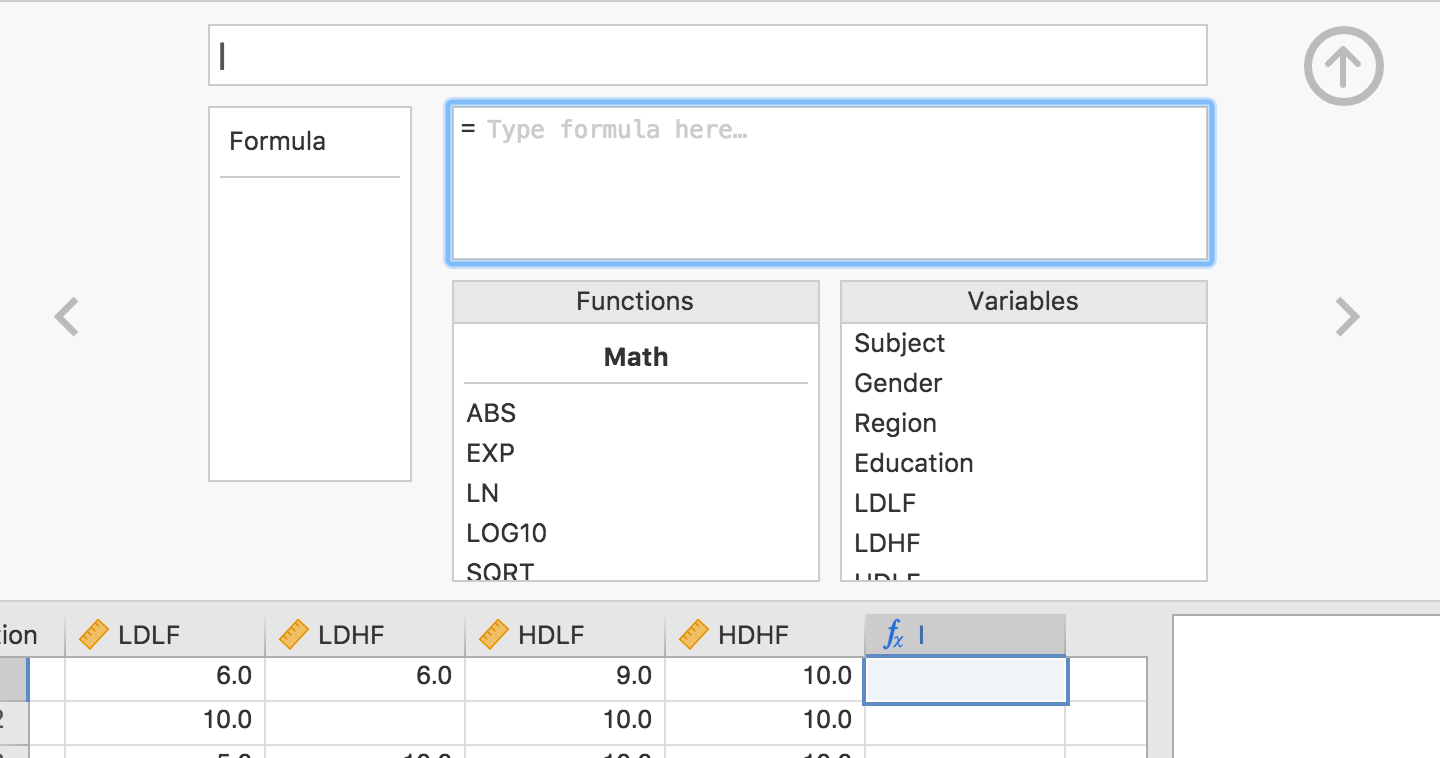
Adding a new computed variable adds an empty column with a  icon. To set up the computed variable, either double-click on the column header, or select
 Setup from the data tab. This allows us to specify a formula for the column, and looks as follows:
Now, lets demonstrate a couple of use cases for the computed variables.
Mean scores
We’ll begin with a simple example of mean scores using the Bugs data set (Ryan, Wilde & Crist, 2013) that is available in jamovi ( Open Examples). In this data set, participants rated how much they wanted to get rid of different categories of repulsive insects. The columns LDLF, LDHF, HDLF and HDHF represent the ‘repulsiveness ratings’ across different categories. We can calculate a mean ‘repulsiveness rating’ for each participant by taking an average of these four scores. We do that with the MEAN() function, and specify the formula as follows:
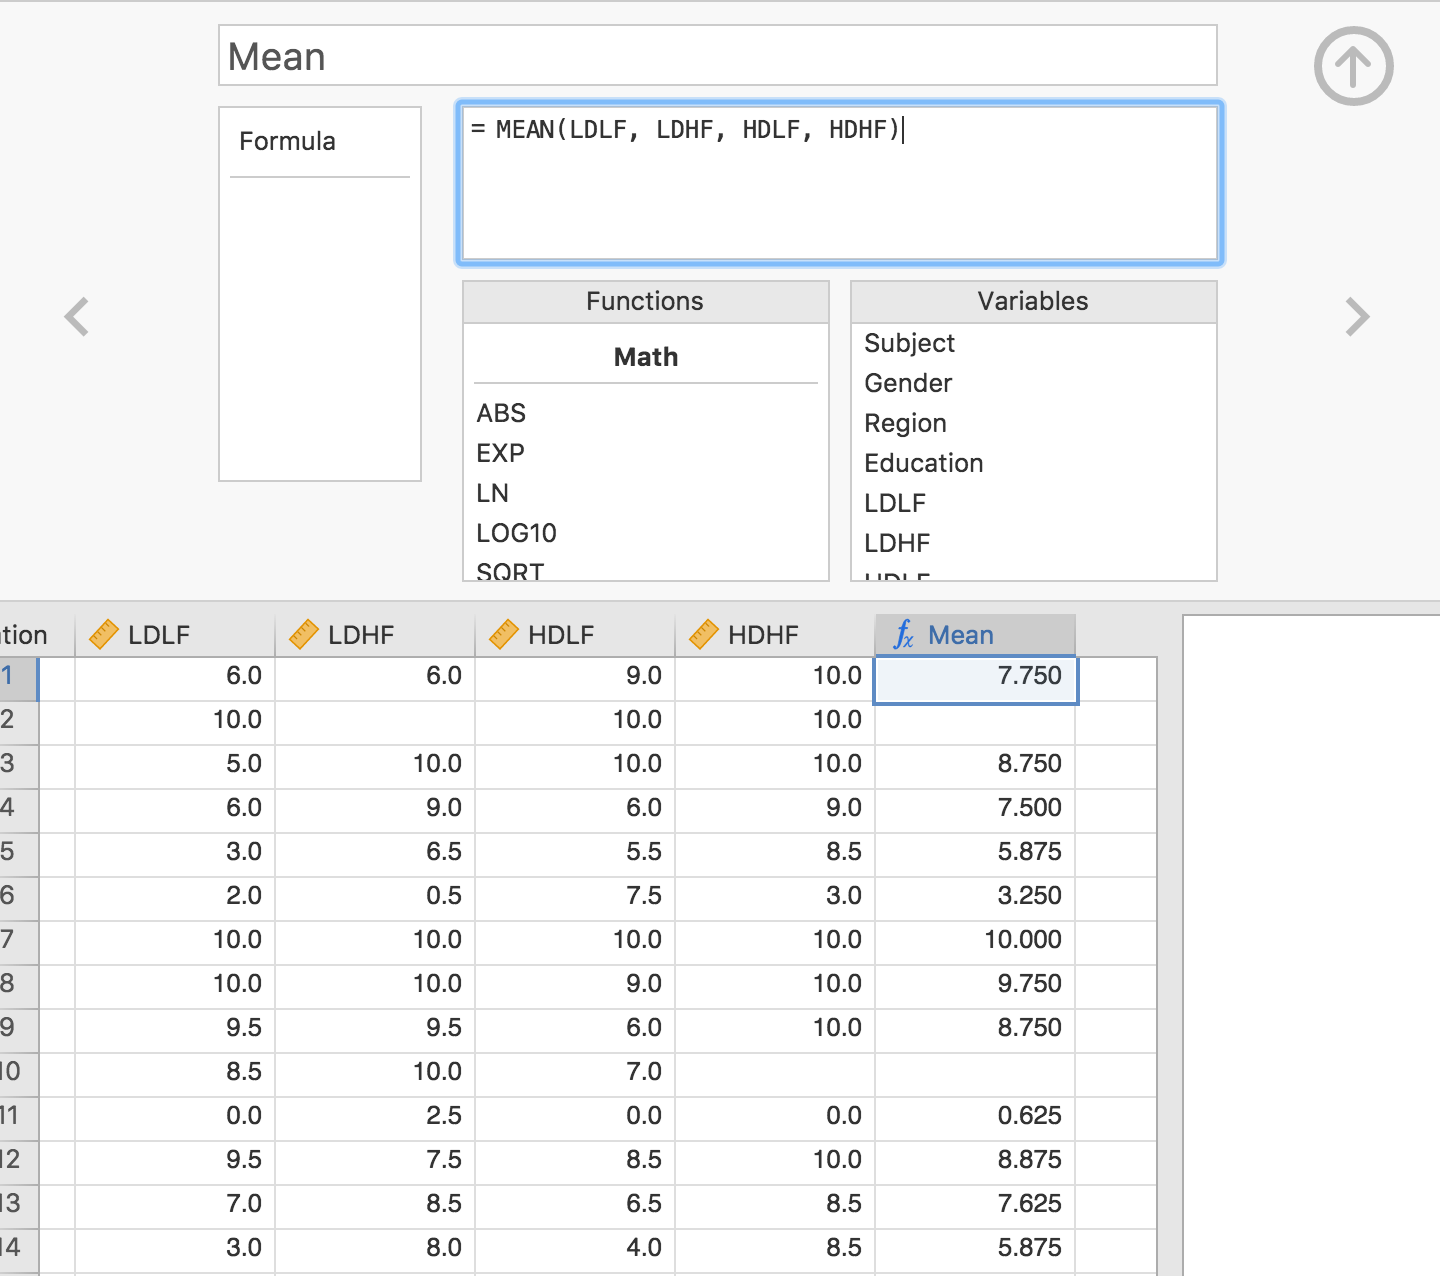
As can be seen, the computed column now contains the mean of those four values.
It’s important to note that these values continue to function as ‘computed values’. Changing any of the source columns (LDLF, etc.) will result in the values of the computed column being automatically updated (and any analyses making use of these columns will update too!). This is different to pseudo-spreadsheets such as SPSS. Once a variable in SPSS is computed, it is ‘dead’; it becomes another data column and it isn’t clear where the data came from. In contrast, computed variables in jamovi remember their ‘state’, allowing people to come and inspect how values are computed, and allowing people to go on and make further changes.
Centred variables (intro to V functions)
A common transform in data analysis is centering variables. In centering, each measurement of a variable has the variable’s overall mean subtracted. However there’s an issue here. The MEAN() function we’ve seen works across variables, one row at a time. What we want here is to take the overall mean of a variable and subtract it from each measurement. For this, jamovi provides special overall functions, or variable functions, which are prefixed with a V. To calculate the variable mean, we use VMEAN().
So for a variable containing the centred values of the LDLF we would use the formula:
LDLF - VMEAN(LDLF)
We can actually do some pretty cool stuff with V functions. Here’s a z-score:
(LDLF - VMEAN(LDLF)) / VSTDEV(LDLF)
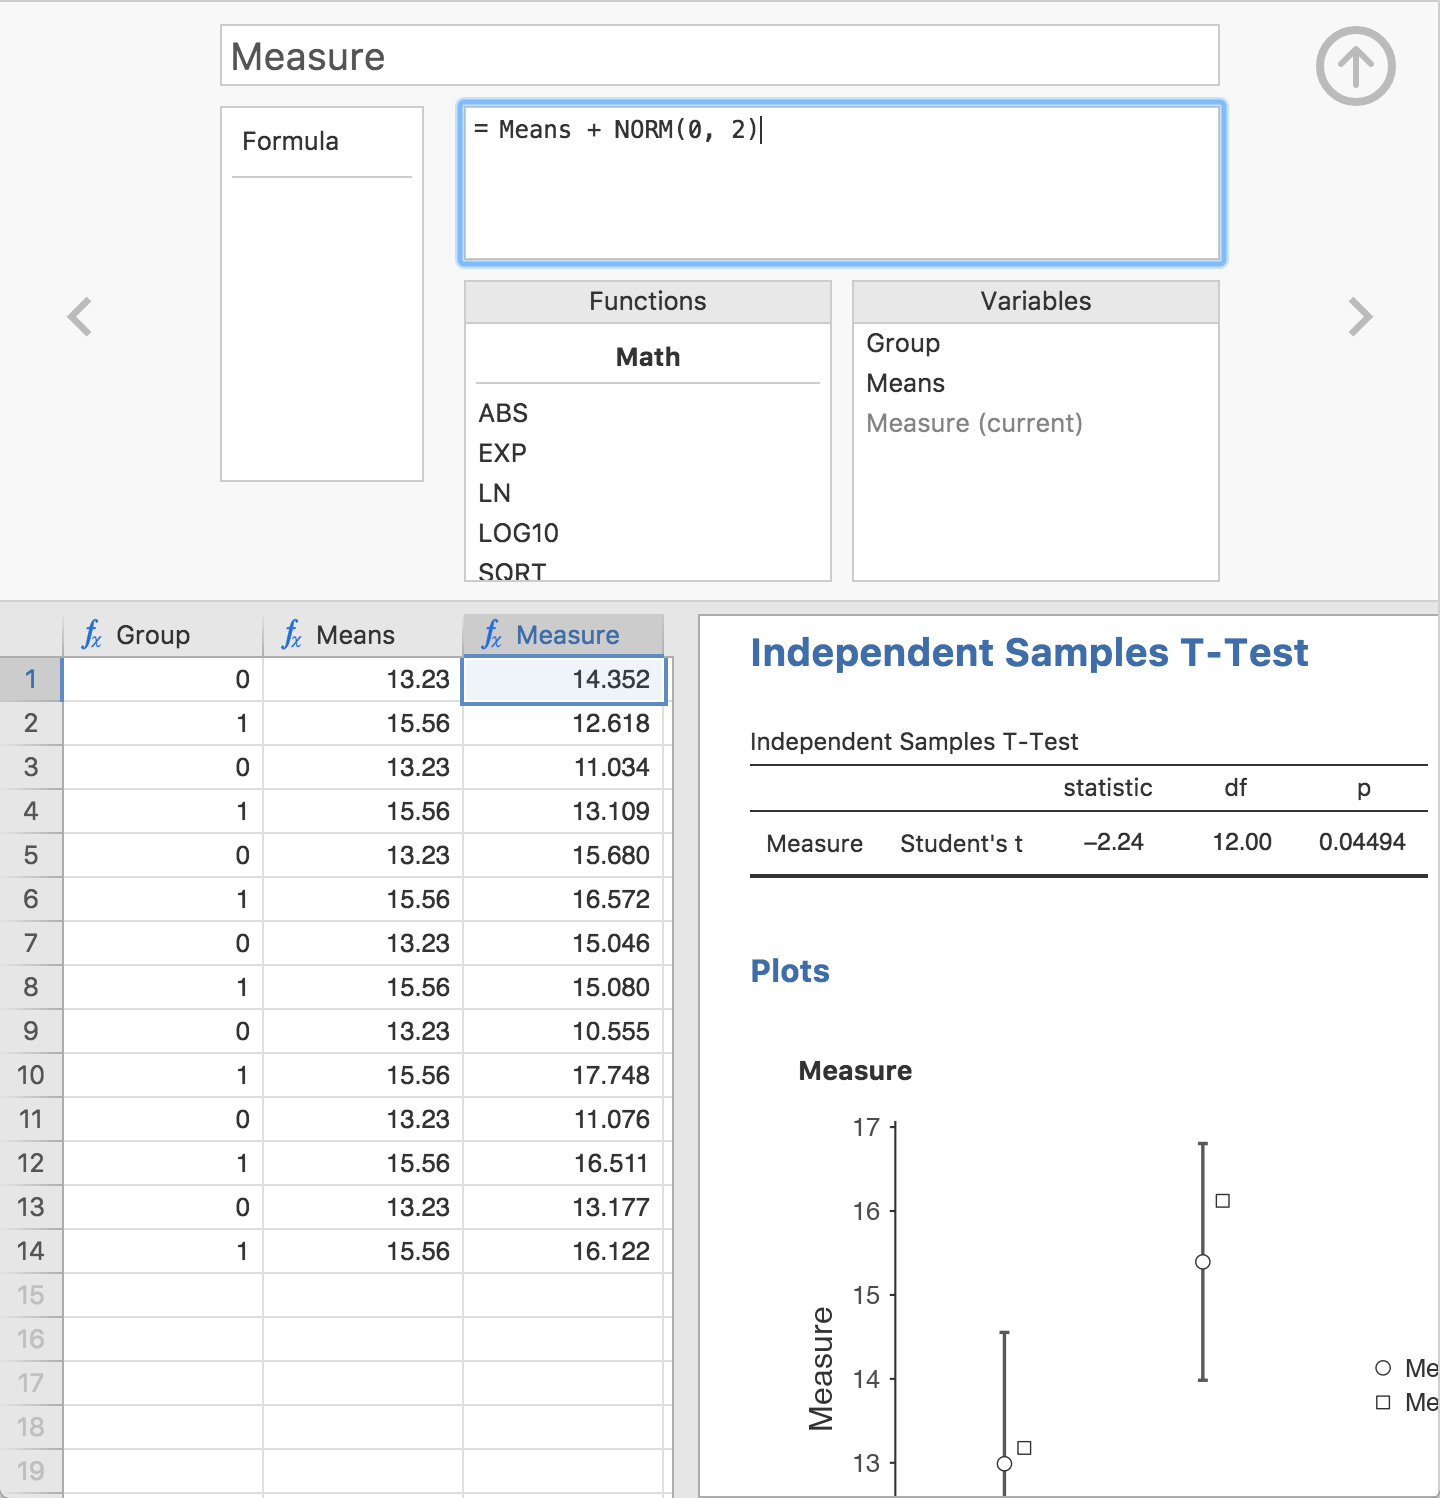
Simulation
This is super cool! No really.
Easy, live simulation can be a powerful demonstration in teaching statistics. I won’t dwell on it too much here, because Ravi wants to do a dedicated blog post on the subject, but the simulation functions in jamovi allow some really cool demonstrations.
In the following example, we simulate data from two populations with systematically different means and then run a t-test on these simulated data. We can adjust the means and the error component, and see how this effects the t-test results (remember, the results update live!).
Again, stay tuned for a future post where we explore these ideas more.
Future development
Although the computed variables in jamovi are already a useful tool for students and researchers alike, they are not yet complete. There are several areas where we intend to improve their functionality. These are:
- More functions (these are generally pretty easy to add, so drop us a line if there’s something important to your field missing)
- The ability to simulate categorical data
- Specialised UIs for common scenarios (it can be tedious to type a formula summing 20 variables, for example)
- Recoding of variables
So stay tuned and make sure to follow us on twitter / facebook / linkedin to keep up-to-date.
Comments